
Roof Replacement Cost in 2026: Why Quotes Stay High Even When Materials Flatten
Homeowners researching roof replacement cost in 2026 usually want two answers: a realistic national benchmark and a clearer way to judge whether a proposal is reasonable. The most useful approach is to separate broad consumer averages from what actually drives installed pricing — scope, labor intensity, roof complexity, and local market conditions.
A useful consumer baseline for many standard replacement projects, not a guaranteed local quote.
Helpful as a midpoint reference when two proposals are built around a similar scope.
Quick math works only when you know actual roof surface area rather than interior floor area.
Tear-off, deck repairs, flashing complexity, ventilation, access, staging, and scheduling all matter.
Verified 2026 national benchmarks
National averages are useful for orientation, but they do not tell you what your house will cost. They are best used to sanity-check a proposal after you confirm that the scope is fully defined and that the roof area being priced is accurate.
| Benchmark | Current Reference | How to Read It |
|---|---|---|
| Typical national consumer range | $5,871 – $13,228 | Good starting point for standard asphalt-shingle replacements before local conditions and scope details are added. |
| National average replacement cost | $9,537 | Useful midpoint for comparing similar bids, but not a substitute for a written proposal. |
| Installed price planning band | $4 – $11 per sq ft | Best for fast budgeting when you know the roof surface area, not just the square footage of the home. |
| Upper-end national cases | Up to $46,000+ | Explains why premium materials, steep geometry, structural upgrades, or unusually complex roofs sit far outside the normal range. |
A roof with several valleys, dormers, skylights, chimney transitions, difficult staging, multiple tear-off layers, or concealed deck damage can move well beyond a generic online average. That is why headline pricing and real proposals are rarely the same thing.
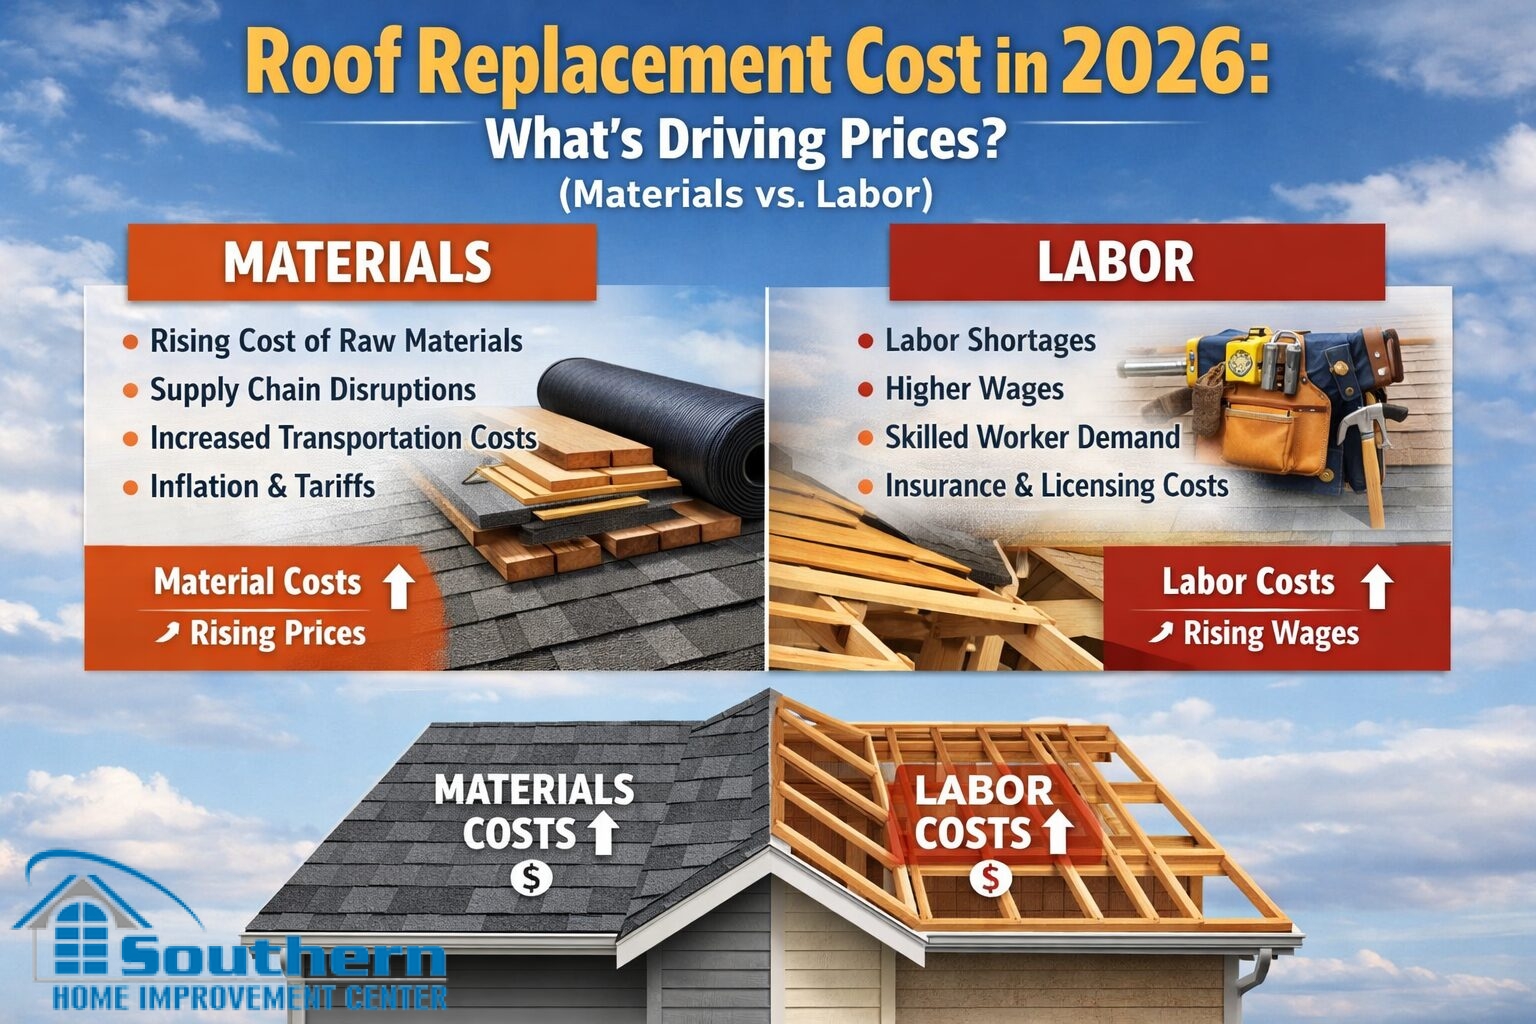
What is actually pushing quotes in 2026
Material headlines do not explain the full installed price of a reroof. Even when a material category levels off, homeowners can still see firmer quotes because contractor-side pricing, labor capacity, sequencing, disposal, supervision, and risk remain part of the final number.
| Index | Oct 2025 | Nov 2025 | MoM Change | What It Suggests |
|---|---|---|---|---|
| Roofing asphalts, pitches, coatings, and cements (PPI) | 299.205 | 299.249 | +0.015% | That specific roofing-material bucket was essentially flat month to month. |
| Roofing contractors, nonresidential building work (PPI) | 223.026 | 224.578 | +0.70% | Contractor-side pricing moved more noticeably than the material bucket above, helping explain why installed quotes can stay firm. |
These indexes are not homeowner quote sheets. They are directional indicators that help explain why a finished roofing proposal can remain sticky even when homeowners hear that “materials have stabilized.”
Materials are only part of the job
Shingles and underlayments matter, but crews, setup, safety, disposal, flashing labor, documentation, and scheduling affect the installed number just as much.
Complex roofs amplify labor
Steep slopes, valleys, wall transitions, skylights, chimneys, and tight access conditions add time even when the base material stays the same.
Better scope costs more
A quote with new flashings, balanced ventilation, stronger dry-in details, and written closeout standards should not price the same as a vague allowance.
Why quotes can still feel high when material prices look calmer
Installed roof pricing is a blend, not a single number. When labor and contractor-side costs carry a meaningful share of the total, even a flat material bucket can leave the overall proposal moving upward. The simple example below shows how that can work on a $12,000 planning figure.
| Assumed Labor Share | Implied One-Month Change | Dollar Change on $12,000 | Illustrative New Total |
|---|---|---|---|
| 40% | ~+0.29% | +$34 | $12,034 |
| 50% | ~+0.36% | +$43 | $12,043 |
| 60% | ~+0.42% | +$51 | $12,051 |
| 70% | ~+0.49% | +$59 | $12,059 |
How to compare roof replacement quotes without guessing
Most quote gaps are scope gaps. The lowest number is only useful when the contractor clearly defines what is included, how problem areas are handled, and what will be documented at closeout. When that language is missing, the risk has usually been pushed down the road rather than removed from the job.
When two estimates look far apart, compare written scope first and headline price second. That is the fastest way to separate a lean scope from a strong one.
National averages are not Gulf Coast pricing
For Southeast Louisiana and the Mississippi Gulf Coast, real-world pricing is shaped by storm exposure, roof geometry, labor intensity, access, disposal logistics, dry-in expectations, ventilation needs, and local installation standards. A national article should help homeowners think more clearly, but a local guide should handle city-level or region-level planning.
Get a scope-first roof estimate you can actually compare
Southern Home Improvement Center (SHIC) serves Southeast Louisiana and the Mississippi Gulf Coast with written roofing proposals built around measured scope, documented details, and practical planning for local conditions.
Call the location closest to you or use the form at the bottom of the page to request a roof evaluation and a written proposal built for clear side-by-side comparison.


